Solar Activity Page


The latest 48 hours worth of data are available as both MPEG and animated GIF movies. The movies are updated every hour that we are in real-time contact with the satellite (see the spacecraft DSN contacts). See also Daily MPEGS for older data.
MPEG MOVIES
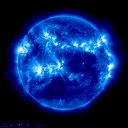
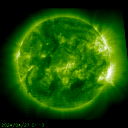
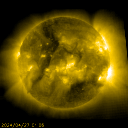
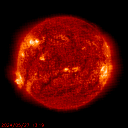
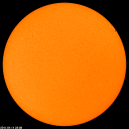
EIT 171 EIT 195 EIT 284 EIT 304
512×512 [1.6M]
512×512 [2.8M]
512×512 [2.4M]
512×512 [3.2M]
256×256 [508K]
256×256 [810K]
256×256 [654K]
256×256 [907K]
 
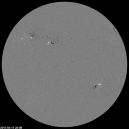
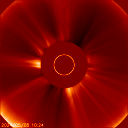
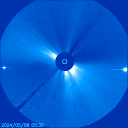
MDI Continuum MDI Magnetogram LASCO C2 LASCO C3
512×512 [3.2M]
512×512 [3.0M]
512×512 [658K]
512×512 [1.8M]
256×256 [486K]
256×256 [436K]
256×256 [174K]
256×256 [286K]
Solar Progression About these images
SOHO is a project of international cooperation between
SOHO
and
SOHO
NOAA Scales Activity
Range 1 (minor) to 5 (extreme)

NOAA Scale

Past 24 hours Max.
Current

Geomagnetic Storms

Solar Radiation Storms

Radio Blackouts

Auroral Map
Auroral Map Movie

The plots on this page show the current extent and position of the auroral oval at each pole, extrapolated from measurements taken during the most recent polar pass of the NOAA POES satellite. "Center time" is the calculated time halfway through the satellite's pass over the pole.


Copyright © 2009 - 2011 West River Radio Club - VT QSO Party Committee- All rights reserved